
Delivery, Project & Service Planning
title
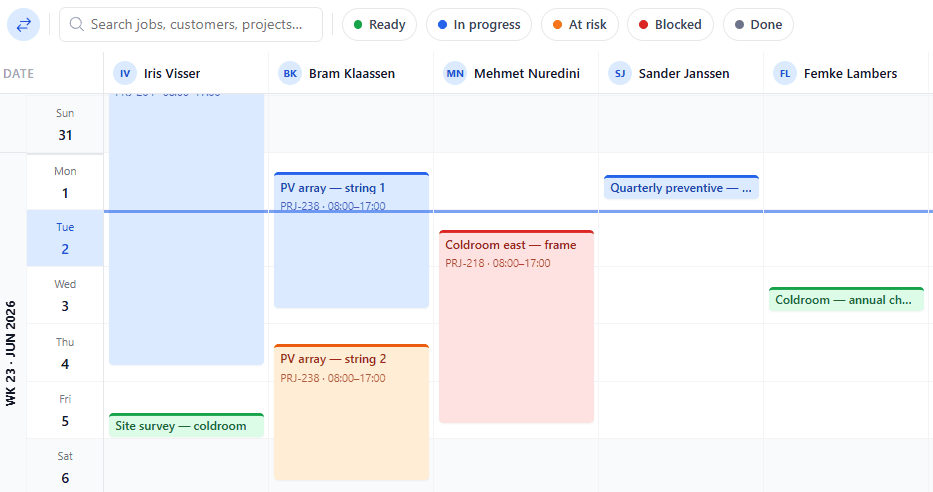
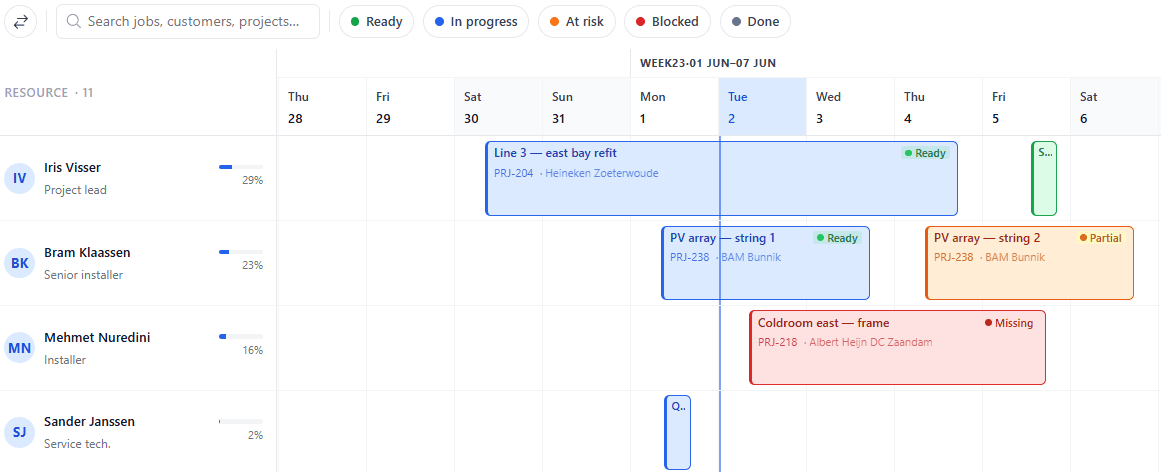
One plan for everything that happens after production.
introline bodytext
Funzionalità · 9
Piano Advanced
title · KPI Dashboard
The numbers a service operations manager lives by.
One screen shows on-time start, first-time fix, average response time, estimated vs. actual time per job, productive vs. travel hours and net bookable capacity for the next 4 weeks. It refreshes continuously, so operations can see whether the week is on track.
The KPIs that matter
On-time start, on-time completion, estimated vs. actual time, productive hours ratio, late activities. Pre-built — no configuration.
Drill from KPI to activity
Click a late-job number → see which customer, which activity, which engineer, which reason. The dashboard is a doorway.
Estimated vs. actual, at a glance
Quoted time against time actually spent, per job and per team. The pattern shows you exactly which work keeps getting under-quoted.
Cosa vedi
A weekly review you actually run.
Most operations weekly reviews are reactive — react to the customer who complained, react to the engineer who quit, react to the cost overrun. A live KPI dashboard makes the review proactive — what is trending, what is at risk, what is improving — and the meeting goes from defence to direction.
- On-time start, on-time completion
- Estimated vs. actual time per job and per team
- Productive hours vs travel vs idle
- Capacity utilisation per team
Quando conta
Segnali che ti serve.
01
Reviews are anecdotal
A weekly review built on memorable bad events misses systemic ones. Numbers expose the system.
02
You find out at month-end
By the time the numbers land in a monthly report, the bad week is long gone. A live dashboard surfaces it while you can still act.
03
Estimates never meet reality
If you never compare quoted time to actual time, the same jobs keep getting under-quoted, and margin leaks one activity at a time.
04
Travel time is unmeasured
A team where 40% of paid hours are travel is a team where routing is broken. Without the measure, nobody fixes it.
Activity completions, time registrations and customer messages stream live. Aggregates refresh hourly by default; drill-downs are always current.
Guarda title in una demo di 30 minuti.
Una vera condivisione dello schermo con chi l'ha creata. Niente slide.
La suite uTools