
uScheduler Project / Service / Sales
One plan for everything that happens after production.
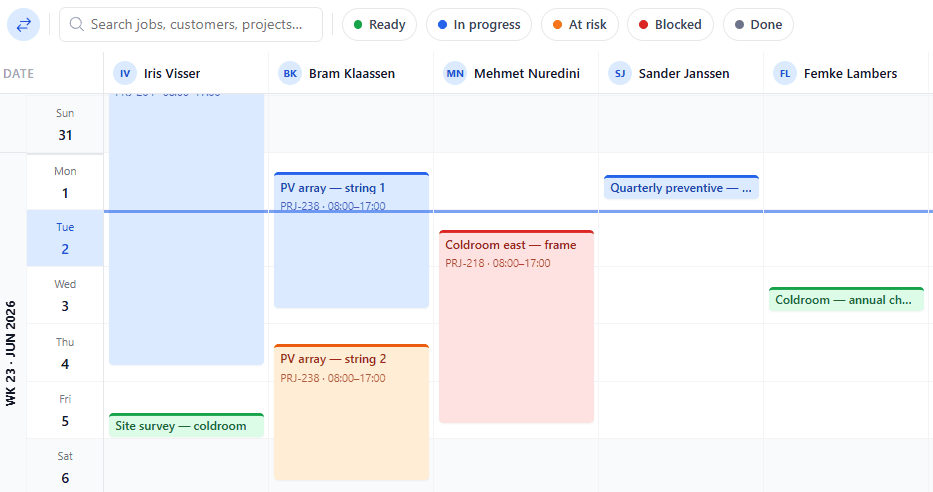
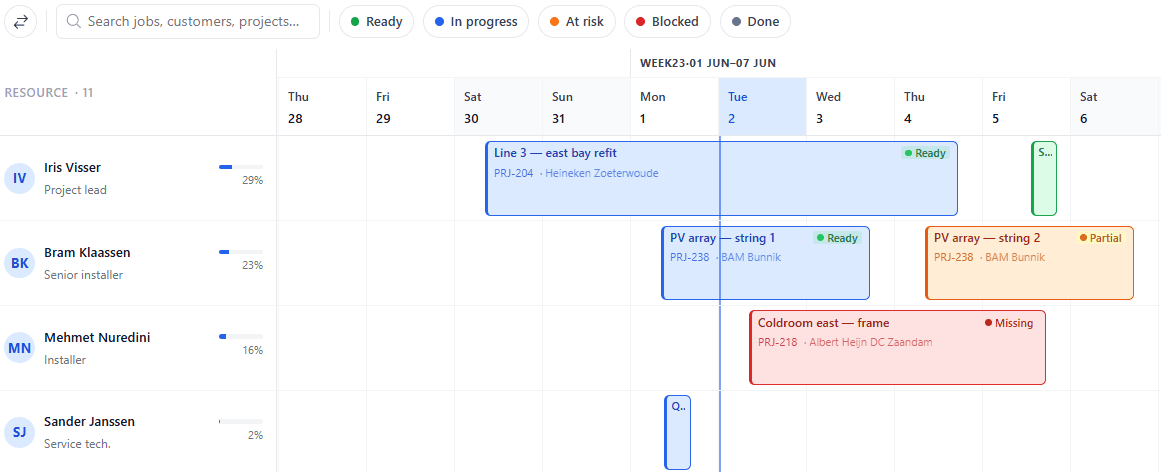
Once production is done, there's still delivery, installation, service and project work to plan. uScheduler P/S/S puts all of it in one overview and plans it against capacity, skills, geography, deadlines and material availability. It also checks whether the parts will be there on the day. Sales, logistics and engineers all look at the same board, so promises get kept and there are fewer surprises.
The numbers a service operations manager lives by.
One screen shows on-time start, first-time fix, average response time, estimated vs. actual time per job, productive vs. travel hours and net bookable capacity for the next 4 weeks. It refreshes continuously, so operations can see whether the week is on track.
A weekly review you actually run.
Most operations weekly reviews are reactive — react to the customer who complained, react to the engineer who quit, react to the cost overrun. A live KPI dashboard makes the review proactive — what is trending, what is at risk, what is improving — and the meeting goes from defence to direction.
- On-time start, on-time completion
- Estimated vs. actual time per job and per team
- Productive hours vs travel vs idle
- Capacity utilisation per team
Les signes que vous en avez besoin.
Les questions que tout le monde pose en premier.
Encore des questions ? Posez-nous la question directement →
Découvrez uScheduler P/S/S lors d'une démo de 30 minutes.
Un vrai partage d'écran avec une personne qui l'a créée. Pas de diapositives.