Delivery, Project & Service Planning

uScheduler Project / Service / Sales

One plan, one reality — for everything after production.

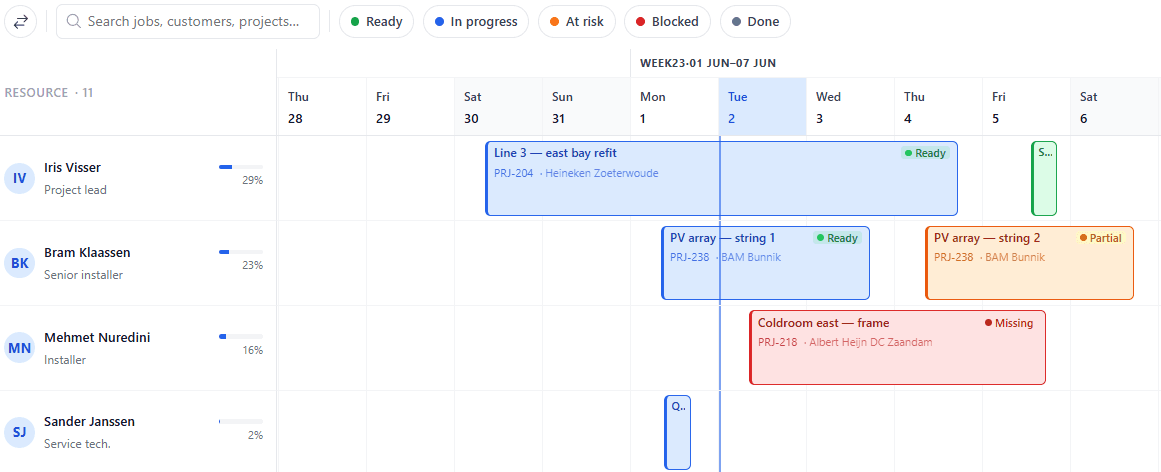
For the phase after production: delivery, installation, service or project execution. Brings all outbound activities together into an intuitive overview, planned against capacity, skills, geography, deadlines and material availability. One thing we add: we also check whether the needed materials are available at that time of execution. Sales, logistics and engineers all read the same board — so promises get kept and surprises become rare.

uScheduler PSS image 1
Functionalities · 9
uScheduler P/S/S · KPI Dashboard

The numbers a service operations manager lives by.

On-time start. First-time fix. Average response time. Estimated vs. actual time per job. Productive hours vs travel hours. Net bookable capacity for next 4 weeks. One screen, refreshed continuously, that tells operations whether the week is winning.

The KPIs that matter
On-time start, on-time completion, estimated vs. actual time, productive hours ratio, late activities. Pre-built — no configuration.
Drill from KPI to activity
Click a late-job number → see which customer, which activity, which engineer, which reason. The dashboard is a doorway.
Estimated vs. actual, at a glance
Quoted time against time actually spent, per job and per team. The pattern shows you exactly which work keeps getting under-quoted.
What you see

A weekly review you actually run.

Most operations weekly reviews are reactive — react to the customer who complained, react to the engineer who quit, react to the cost overrun. A live KPI dashboard makes the review proactive — what is trending, what is at risk, what is improving — and the meeting goes from defence to direction.

  • On-time start, on-time completion
  • Estimated vs. actual time per job and per team
  • Productive hours vs travel vs idle
  • Capacity utilisation per team
uScheduler PSS image 2
When this matters

Signals you'd reach for this.

01
Reviews are anecdotal
A weekly review built on memorable bad events misses systemic ones. Numbers expose the system.
02
You find out at month-end
By the time the numbers land in a monthly report, the bad week is long gone. A live dashboard surfaces it while you can still act.
03
Estimates never meet reality
If you never compare quoted time to actual time, the same jobs keep getting under-quoted — and margin leaks one activity at a time.
04
Travel time is unmeasured
A team where 40% of paid hours are travel is a team where routing is broken. Without the measure, nobody fixes it.
FAQ

The questions everyone asks first.

Still wondering? Ask us directly →

Activity completions, time registrations and customer messages stream live. Aggregates refresh hourly by default; drill-downs are always current.

See uScheduler P/S/S in a 30-minute demo.

A real screen-share with someone who built it. No slides.

The uTools suite

Other apps that pair well with uScheduler P/S/S