Production Planning

uScheduler Production

A production plan you can actually execute.

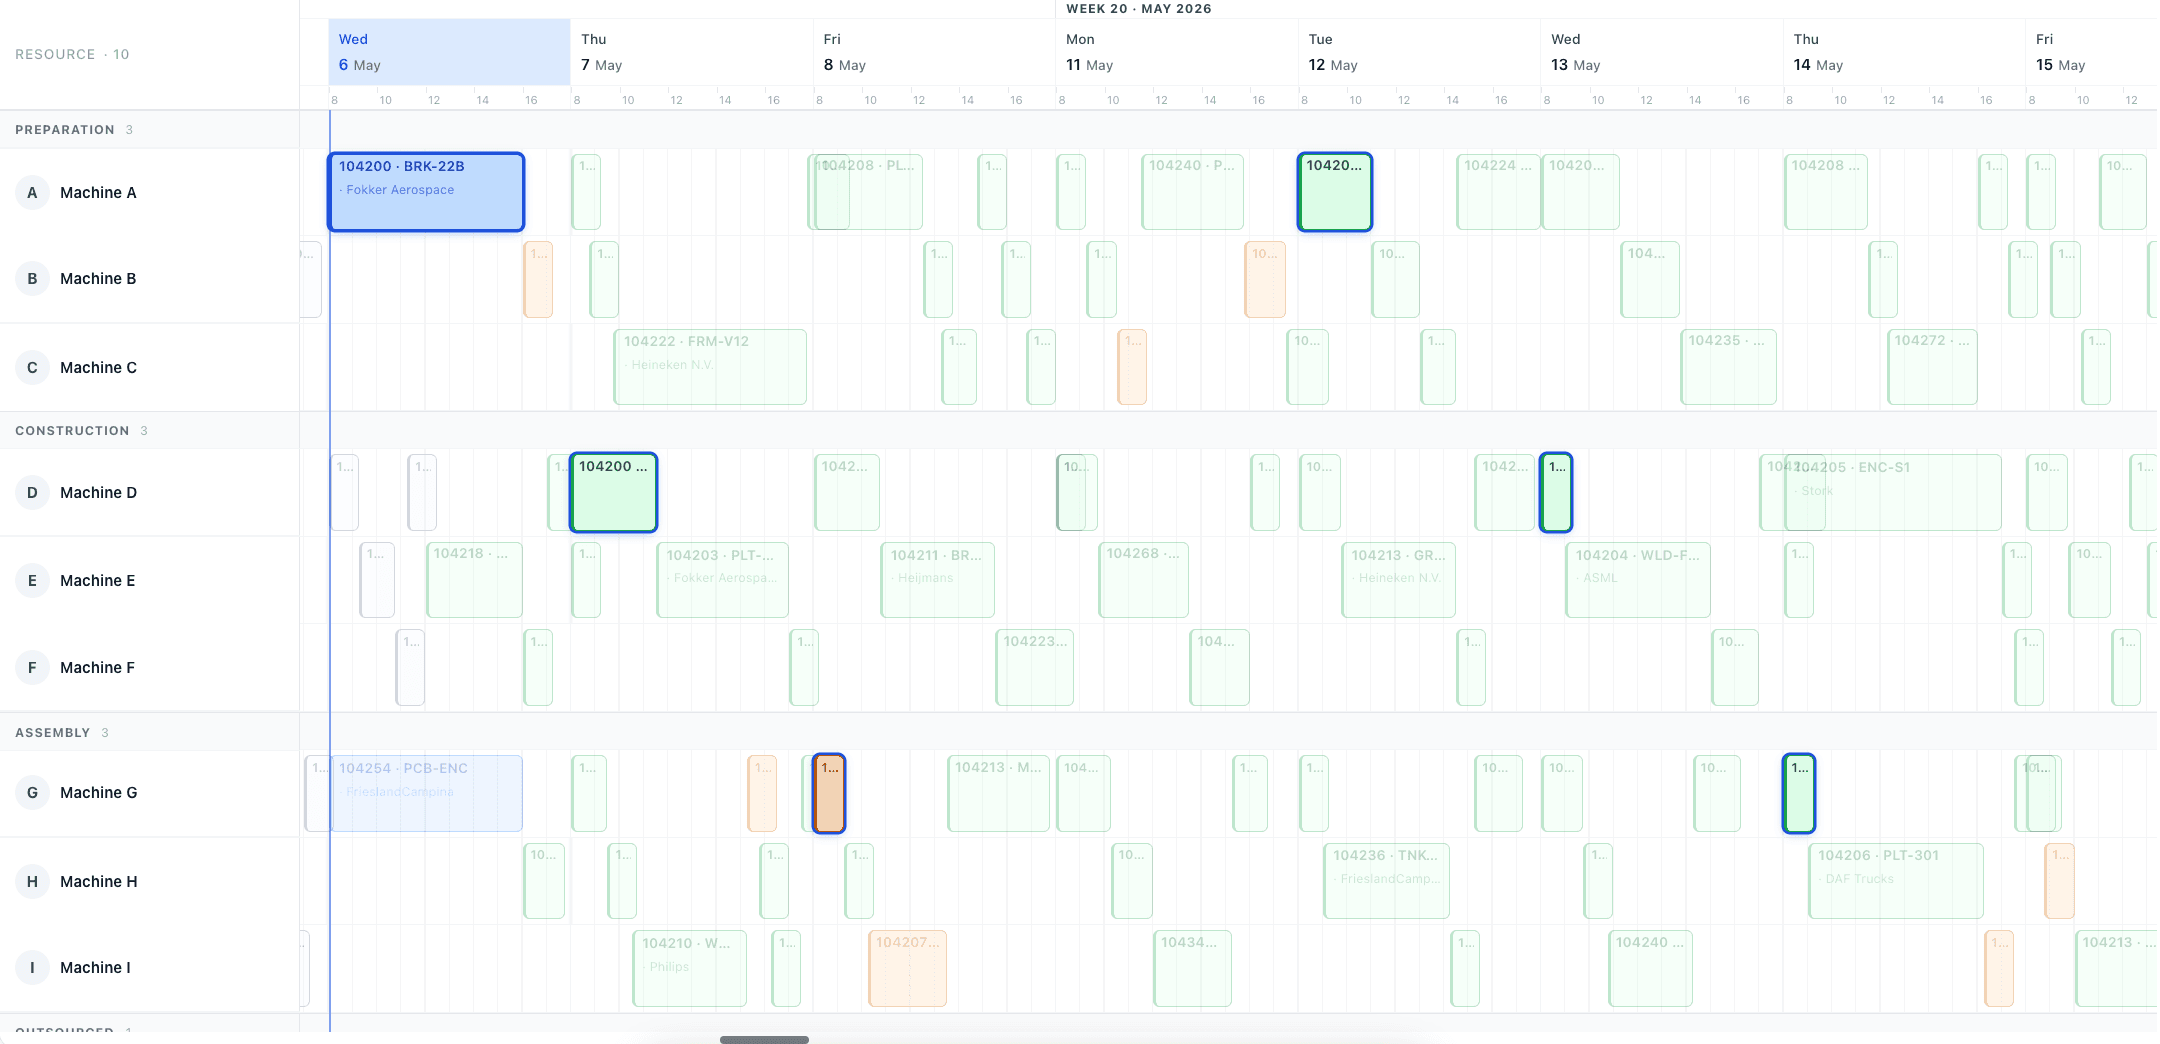
Most production planning tools draw beautiful Gantts that nobody can act on. uScheduler Production starts from the opposite premise: every cell on the board is a decision waiting to be made. Drag an order and capacity, tooling, qualifications, sequencing and material availability all update instantly — if something does not fit, it becomes visible. Auto-Plan proposes a feasible starting point; the planner refines it; nothing changes on the floor without the planner committing. The result is a plan you can show on a screen above the line without explaining, and defend in a sales meeting when somebody asks "when can we ship it?".

Production planning board showing work centers and scheduled orders for week 19
Functionalities · 8
uScheduler Production · Year View

A full year, one screen, every work centre.

Zoom out from the day to the year. See where you have room left and where you are overbooked, week by week, per work centre or per machine centre — so the conversation moves from "can we fit this in next Tuesday?" to "where does Q3 actually break?".

Every week of the year, at a glance
One row per work centre, one column per week, 52 cells across. Blue where there is room, orange where it is tight, red where you are overbooked. Scan a row, find the squeeze.
Work centre and machine centre, side by side
Both roll-ups on the same screen. Some bottlenecks live at the work-centre level; others hide inside it — one specific CNC, one specific oven. You see both at once, no toggle, no context switch.
Drill from year to day
Click any week to drop straight into the planning board for that week. The year view is the doorway; the daily plan is where you commit.
What you see

The plan you defend at the management meeting.

The board is for tomorrow. The year view is for the conversation about hiring a second shift, buying a second machine, or pushing a customer to a different delivery window. Most planning tools force you to build a separate capacity model in Excel for those conversations — the year view shows the same source data the plan already runs on, rolled up to the weeks ops and finance already think in.

  • 52 weeks, every work centre, on one screen
  • Work-centre and machine-centre roll-ups side by side
  • Load vs capacity in colour: blue, orange, red
  • Click a week to drop into the planning board
  • Same data as the live plan — no separate model to maintain
  • Holidays, maintenance and planned downtime already subtracted
Auto-plan menu: fill idle times, move to earliest possible date, move to just-in-time
When this matters

Signals you'd reach for this.

01
Capacity models live in Excel
Operations builds a yearly capacity model once a quarter in Excel, from data already in Business Central. Three months later it is stale and nobody updates it.
02
Bottlenecks announce themselves at quote time
Sales promises a Q3 delivery without knowing Q3 is already 110% loaded on the bottleneck machine. The discovery happens at scheduling — too late to renegotiate.
03
You cannot see the year from the daily board
The planning board is built for tomorrow. Asking it to also answer "is October overbooked?" is asking the wrong tool the wrong question.
04
Hiring decisions arrive too late
A second shift takes months to staff. If the overload only becomes visible in the week it hits, the decision is already late.
FAQ

The questions everyone asks first.

Still wondering? Ask us directly →

Planned hours against available capacity for each week, per work centre. Available capacity comes from the shift calendar — holidays, maintenance windows and planned downtime are all subtracted. Below 85% is blue (room left), 85-100% orange (tight), above 100% red (overbooked). Thresholds are configurable.

See uScheduler Production in a 30-minute demo.

A real screen-share with someone who built it. No slides.

The uTools suite

Other apps that pair well with uScheduler Production