Production Planning

uScheduler Production

A production plan you can actually execute.

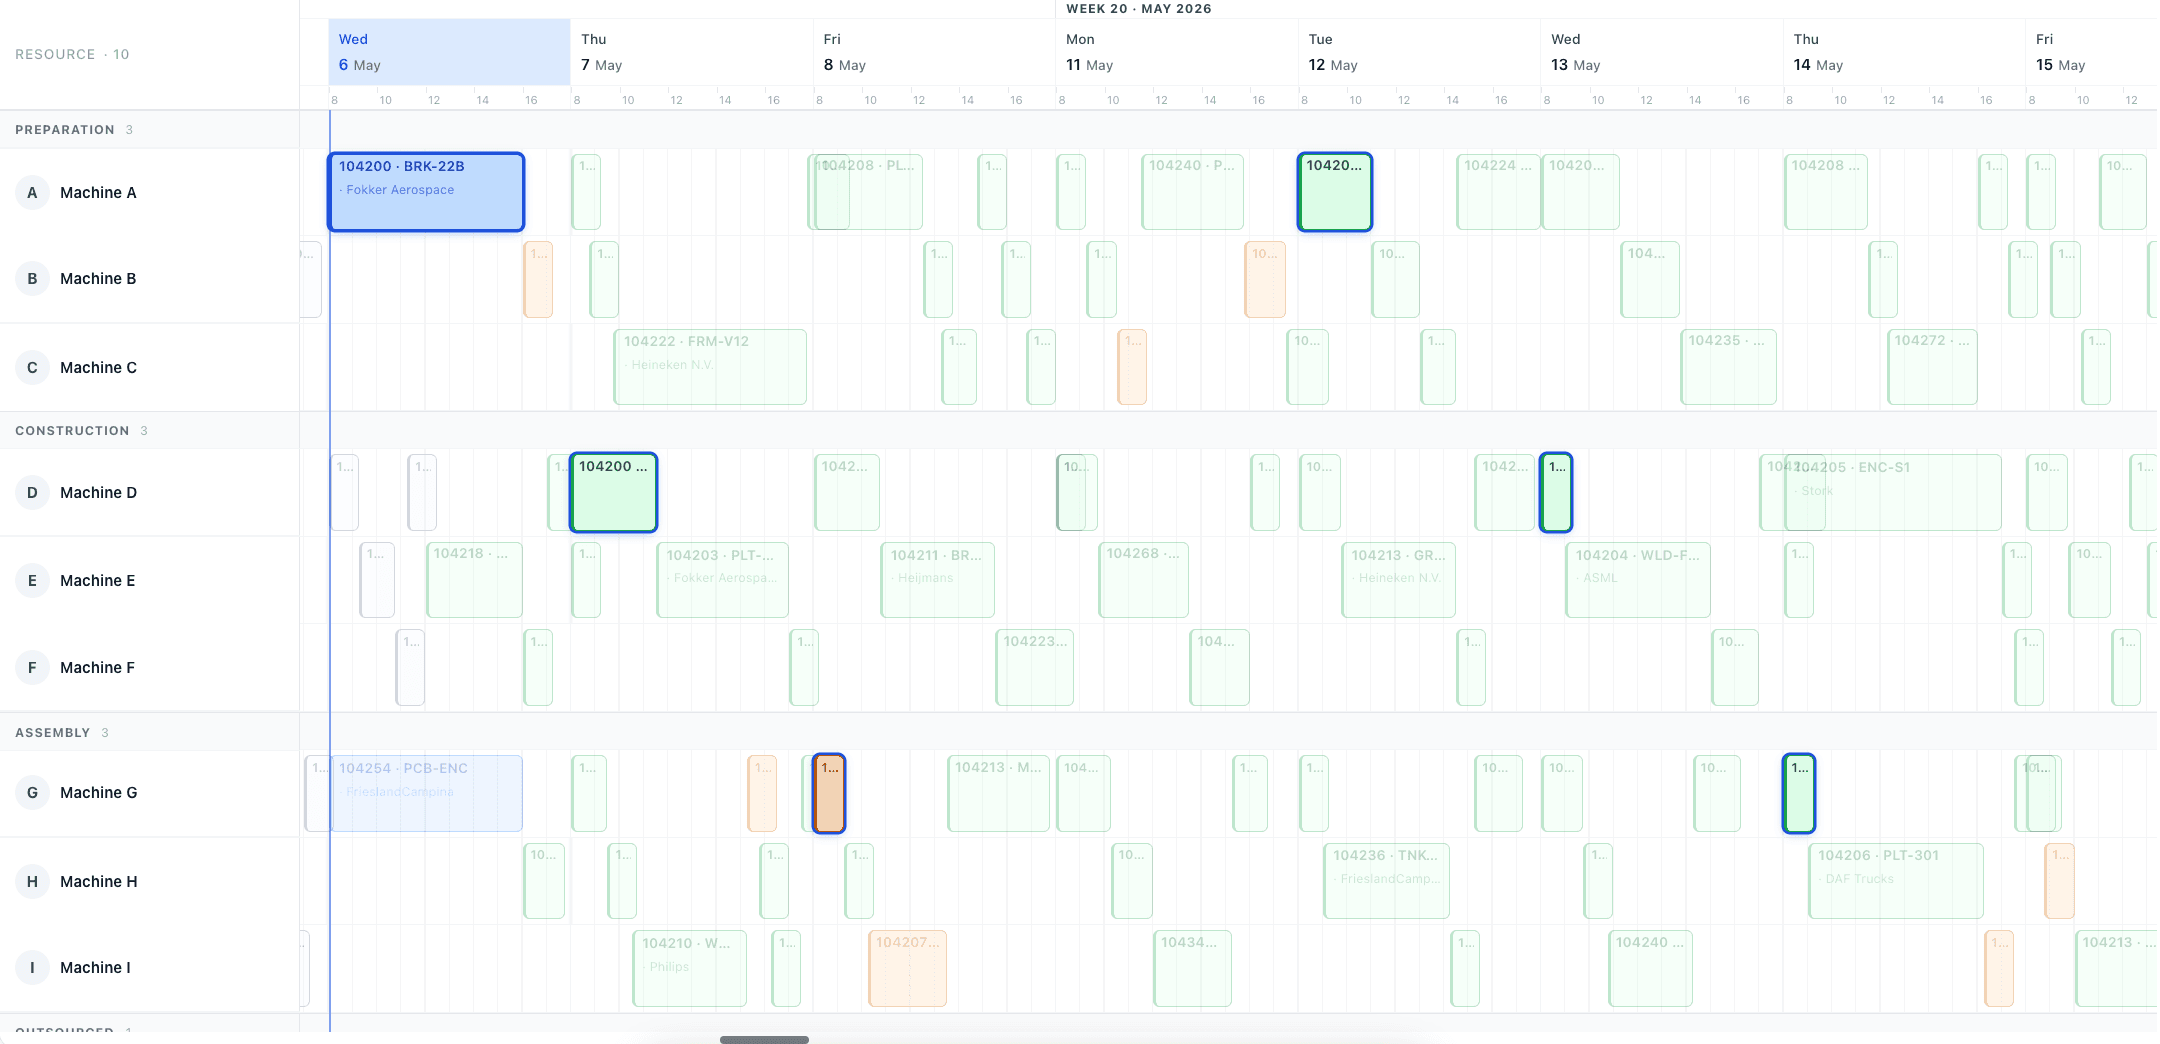
Most production planning tools draw beautiful Gantts that nobody can act on. uScheduler Production starts from the opposite premise: every cell on the board is a decision waiting to be made. Drag an order and capacity, tooling, qualifications, sequencing and material availability all update instantly — if something does not fit, it becomes visible. Auto-Plan proposes a feasible starting point; the planner refines it; nothing changes on the floor without the planner committing. The result is a plan you can show on a screen above the line without explaining, and defend in a sales meeting when somebody asks "when can we ship it?".

Production planning board showing work centers and scheduled orders for week 19
Functionalities · 8
uScheduler Production · KPI Dashboard

The plan and the score, on the same screen.

On-time completion. Capacity utilisation. Schedule adherence. Setup hours lost. Late orders. Forecast vs actual throughput. One screen, refreshed continuously, that tells a planner whether the floor is winning — and lets a controller answer the same question without a spreadsheet.

The KPIs that actually matter
On-time start, on-time finish, schedule adherence, capacity utilisation, OEE-style availability, late orders, setup time as % of run time. Pre-built, no configuration.
Live, not lagged
Every tile reads straight from the same data the floor is writing. No nightly job, no warehouse hop — when an operator reports time, the number on the screen moves. Yesterday's on-time is on the screen before this morning's standup.
A floor view for the wall screen
A second, read-only layout designed for a TV above the line: large type, no chrome, the KPIs that matter to that area auto-rotating. The number the planner sees on their laptop is the same number the floor sees on the wall.
What you see

A dashboard you read every morning.

Most dashboards get checked once a quarter. uScheduler puts the KPIs on the same workspace as the plan — so a planner sees yesterday's score before they touch today's plan. The act of opening the tool is the act of seeing the result of your last decisions.

  • On-time start, on-time finish, schedule adherence
  • Capacity utilisation per work centre and aggregated
  • Setup hours as % of total run hours
  • Late orders, days late, EUR exposure
  • Throughput: planned vs actual per shift
Auto-plan menu: fill idle times, move to earliest possible date, move to just-in-time
When this matters

Signals you'd reach for this.

01
Reports come from accounting
When the only "are we on time?" number comes from finance month-end, planners are blind during the month.
02
Targets are aspirational
A 95% on-time target without a daily readout is wishful thinking. Visibility creates accountability.
03
Improvement is invisible
A 2-point on-time improvement is real money — if anyone can see the trendline.
04
A KPI in Excel changes nothing
A number pasted into a deck once a month is a report, not a feedback loop. Improvement needs the readout next to the work, refreshed while the shift is still running.
FAQ

The questions everyone asks first.

Still wondering? Ask us directly →

Live. Every KPI on the dashboard reads from the same data the floor is writing — no hourly sync, no nightly refresh, no staging table. When an operator reports time, the number on the screen moves.

See uScheduler Production in a 30-minute demo.

A real screen-share with someone who built it. No slides.

The uTools suite

Other apps that pair well with uScheduler Production