uPurchase
Demand forecasting and purchasing, in one screen.
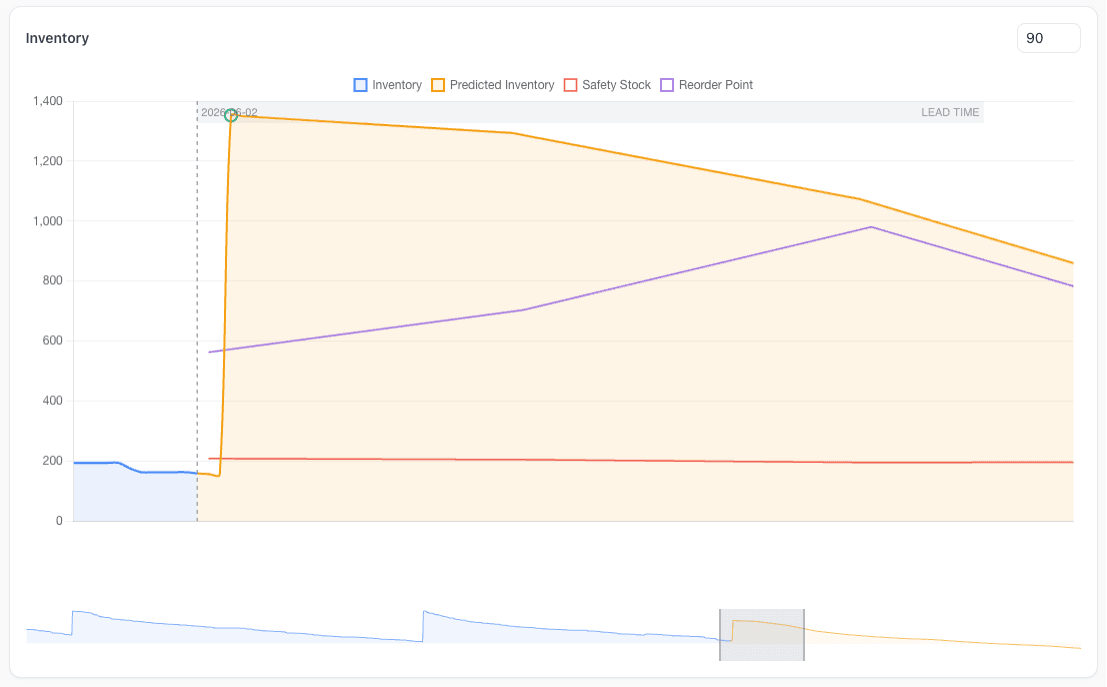
uPurchase is the demand-forecasting and inventory-intelligence layer Business Central never had. It classifies every SKU, forecasts demand by location, sizes safety stock against a chosen service level, applies supplier calendars and lead times, weighs carrying cost against stockout risk — and then turns the whole picture into concrete, explainable purchase suggestions. Every recommendation answers the question "why" before you have to ask it: the forecast, the safety stock, the lead time and the current position all live on the same row as the quantity. Edit any number and the projected stock curve updates before anything is committed to Business Central. Purchasers get to challenge the numbers instead of trusting them blind, and controllers see service level, stockouts and excess as daily KPIs rather than monthly autopsies.

Forecasts that learn from what actually happened.
Statistical and pattern-based forecasts trained on your real consumption. Updated daily. Always visible — the trend, the seasonality, the confidence band — so you can sanity-check a number before you commit money to it.
A forecast is a hypothesis.
Most forecasting tools produce a single number and ask you to trust it. uPurchase produces a number plus the working — the model, the assumptions, the historical fit. When something looks wrong, it usually is, and you can correct it inline before it becomes a stockout or an excess.
- Live forecasts per item, per location — always current with the latest Business Central data
- Automatic model selection per demand pattern (stable, seasonal, intermittent, lumpy)
- Outlier detection — promotions, one-off projects, data errors
- Forward overrides for known events (campaigns, contracts, end-of-life)
- Forecast accuracy tracked over time, per item and per category
- Side-by-side actual vs forecast chart across your full data history — look back as far as you want
Signals you'd reach for this.
See uPurchase in a 30-minute demo.
A real screen-share with someone who built it. No slides.